The Angular DevOps Series: CT and Code Coverage with TeamCity
There is more to Istanbul than Constantinople

This article describes how to set up Continuous Testing and Code Coverage for Angular Applications. Then it continues to show how to integrate this into TeamCity. We will configure TeamCity so that upon pushing a new commit for our Angular application it will:
Run the Unit Tests
Create a Code Coverage report
Build the application for production
Even if you are not using TeamCity you can apply the parts up until the integration and instead, use the tool of your choice.
Prerequisites: Basic knowledge of unit testing in Angular.
The Angular DevOps Series
This is the fourth post in the Angular DevOps Series. Make sure you take a look at the other posts in the series by Tim Deschryver, Todd Palmer and Andrew Evans:
Definitions
Continuous Integration (CI) is the practice of merging all developer working copies to the shared mainline several times a day.
In CI each integration is verified by an automated build to detect integration errors as quickly as possible. Having a reliable CI process builds trust in the system.
Continuous testing (CT) is the process of executing automated tests as part of the software delivery pipeline. It’s easy to forget to run tests but CI servers let you set up your project repository so that your tests run before every build.
CT is key to unlocking the agile culture change because it weaves testing activities into every part of the software design, development, and deployment processes.
Code coverage is a measure of how much code is covered by the tests.
Code coverage shows you what code was covered during the automated tests run on the build server. You can then use this information to direct focus on areas that are not sufficiently tested to drive up code quality.
TeamCity is a Java-based build management and CI server from JetBrains. TeamCity is commercial software and licensed under a proprietary license. A Freemium license for up to 100 build configurations and 3 free Build Agent licenses is available. Open Source projects can request a free license.
Tests
Let’s start by creating a few unit tests. To make it simple I will use the tests that are created for app.component.ts when we create a new project with the Angular CLI.
import { TestBed, async } from '@angular/core/testing';
import { AppComponent } from './app.component';

describe('AppComponent', () => {
  beforeEach(async(() => {
    TestBed.configureTestingModule({
      declarations: [
        AppComponent
      ],
    }).compileComponents();
  }));

  it('should create the app', () => {
    const fixture = TestBed.createComponent(AppComponent);
    const app = fixture.debugElement.componentInstance;
    expect(app).toBeTruthy();
  });

  it(`should have as title 'unittest'`, () => {
    const fixture = TestBed.createComponent(AppComponent);
    const app = fixture.debugElement.componentInstance;
    expect(app.title).toEqual('unittest');
  });

  it('should render title in a h1 tag', () => {
    const fixture = TestBed.createComponent(AppComponent);
    fixture.detectChanges();
    const compiled = fixture.debugElement.nativeElement;
    expect(compiled.querySelector('h1').textContent).toContain('Welcome to unittest!');
  });
});
When we run this with npm t we see that all three tests pass.

Code Coverage
Turning on code coverage means that you will be able to display what code your tests are exercising, and perhaps more importantly, what code isn’t being exercised. You can drill into the metrics to get a better understanding of it.
If You Can’t Measure It, You Can’t Improve It.
Let’s start by running the command for creating the code coverage report.
ng t --code-coverage
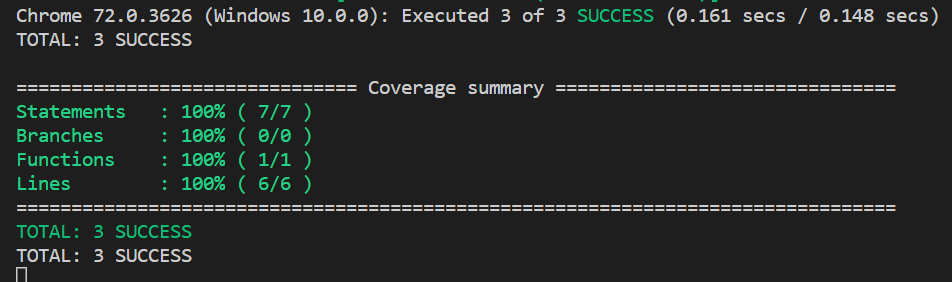
We get a Coverage summary in the console. And there is now a new “coverage” folder in the project root directory. This holds the coverage report in HTML. If we click the index.html we see the report.
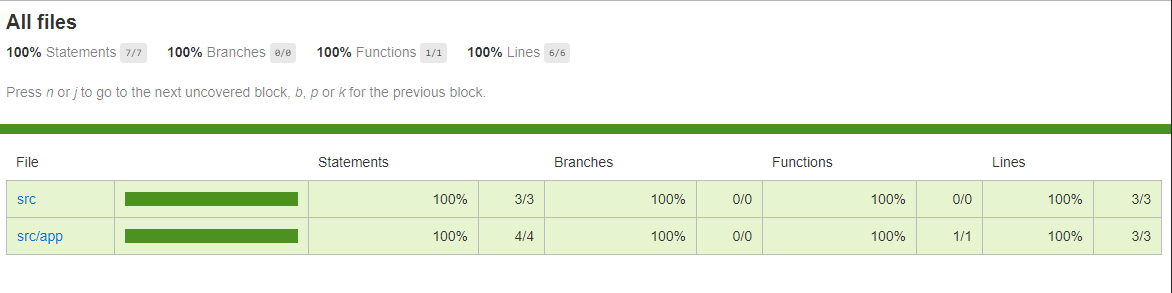
And if we drill down to the app.component.ts file we see what lines of code are getting exercised by the unit tests.
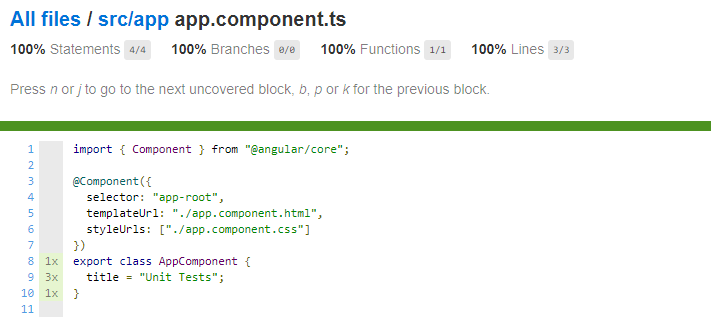
Istanbul
It is a tool called Istanbul that creates the code coverage reports. It instruments the JavaScript code with line counters so that you can track how well the unit-tests exercise your code base. It has HTML and LCOV reporting.
It works well with most JavaScript testing frameworks and provides simple integrations to Jasmine and TeamCity that we are using. The important part is that it creates HTML reports which in turn can be read by TeamCity.
We now have generated a code coverage report. The next step is to integrate it into TeamCity.
Headless browser
Before we can start integrating with the CI system we need to address something. Locally it works fine using a normal browser for the unit tests. But on the build server, we can’t actually launch a browser GUI. The solution to this is called a headless browser.
A headless browser is a web browser without a graphical user interface.
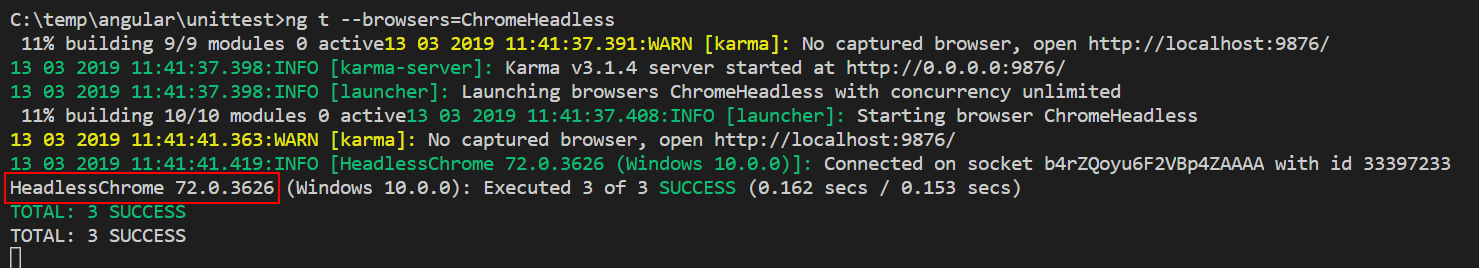
We can use Headless Chrome by adding a flag when we run our tests.
ng t --browsers=ChromeHeadless
If we run this command we don’t have the browser popping up anymore and we can see that we instead are using the headless browser.
TeamCity
Turning on CT and code coverage in TeamCity means that you will be able to display these metrics after the build is complete. You will also be able to see the progress in the number of tests and code coverage over time. Another bonus is that you can stop the build if there is an error in the tests. This will encourage people to keep the tests working.
If you are reading this blog you probably already are using TeamCity as your build management tool. So the interesting part is how we can integrate with it.
Unit Tests
The first thing we need is to have a format that TeamCity can read. To get this we can install an npm package called karma-teamcity-reporter.
npm i karma-teamcity-reporter
We then need to add it to plugins and reporters in karma.conf.js.
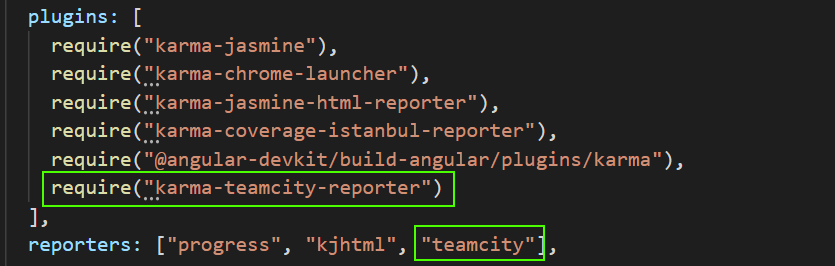
And now when we run our tests again we can see that the format is for TeamCity.
ng t --reporters=teamcity --browsers=ChromeHeadless

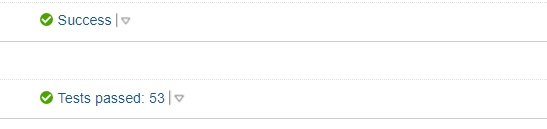
If we run this script in TeamCity the unit tests will be run. Before we had the unit tests running it only said “Success” but now we can see that we have passing tests in our build.
Like this blog post? Share it on Twitter! 🐦
Code Coverage
The next step is to get the coverage report in. For that, we add the code-coverage flag again. We also need to add coverage-istanbul to the reporters since we are overriding the default reporters list.
ng t --no-watch
     --code-coverage
     --reporters=teamcity,coverage-istanbul
     --browsers=ChromeHeadless
code-coverage option only works if the reporters' list includes a coverage tool. If no coverage reporter is present, it fails silently.
reporters switch replaces the default reporters list, so coverage-istanbul has to be explicitly re-added.
coverage-istanbul reporter does not produce a report on its own; the — code-coverage switch is still required.
Move testing packages to dependencies to be able to run CT on the build server.
Now we have the script ready that runs our tests and creates the code coverage report. Next, let’s configure TeamCity.
Artifact
To get the Istanbul coverage HTML report into TeamCity we can publish a TeamCity artifact. Most of the tools produce coverage reports in HTML format. You can publish it as an artifact and configure a report tab to show it in TeamCity.
If an artifact is published in the root artifact directory and its name is coverage.zip and there is an index.html file in it, the report tab will be shown automatically.
The easiest way to get TeamCity to recognize your coverage report is to output a build artifact that contains that nice HTML coverage report. Then you add the path to your zipped report artifact under:
Settings -> General Settings -> Artifact Paths:
coverage/** => coverage.zip
The path must be relative to the root of the build artifact directory.
When we click into our build we see a nice overview of our tests and there should now exist a Code Coverage tab.
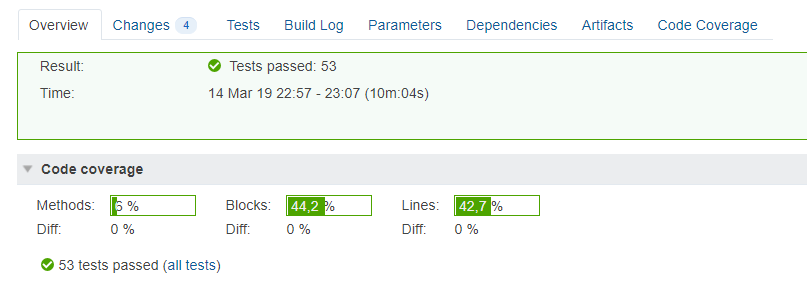
From the code coverage tab, we get the same report we had locally with nice navigation of our file structure.

Enforcement
If your team decides on a set minimum amount to be unit tested, you can enforce this minimum. For example, suppose you want the code base to have a minimum of 80% code coverage. To enable this, open karma.conf.js, and add the following in the coverageIstanbulReporter: key.
coverageIstanbulReporter: {
  reports: [ 'html', 'lcovonly' ],
  fixWebpackSourcePaths: true,
    thresholds: {
    statements: 80,
    lines: 80,
    branches: 80,
    functions: 80
  }
}
Cover all files
If you don’t have a spec file for every TypeScript file then your coverage report will be too optimistic. To get a more truthful percentage I added a test file app.module.spec.ts where I import app.module. This means all the files in your application will be exercised and checked if they have been tested. With lazily loaded modules you will probably have to make an explicit import for them as well.
Adding this to a project will give you a more truthful picture of your coverage.
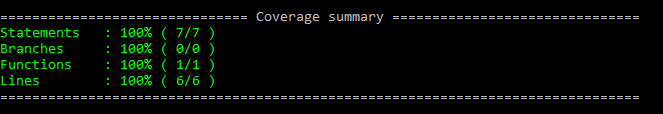 Before
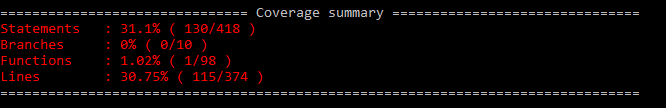 After
After
Script to config
As we can see the script has become quite long by now.
ng t --no-watch
     --code-coverage
     --reporters=teamcity,coverage-istanbul
     --browsers=ChromeHeadless
Architect is the tool that the CLI uses to perform complex tasks, such as compilation and test running, according to provided configurations.
Let’s add our alternative configuration under the test target in the architect section and call it ci-release.
"configurations": {
  "ci-release": {
    "watch": false,
    "codeCoverage": true,
    "reporters": [
      "teamcity",
      "coverage-istanbul"
    ],
    "browsers": [
      "ChromeHeadless"
    ]
  }
}
And now the long script is only a short call for the configuration.
ng t --configuration=ci-release
Much better! Thanks to Lars Gyrup Brink Nielsen for this tip.
Conclusion
Now we have scripts ready for production that do all the things promised in the beginning:
Run the Unit Tests
Create a Code Coverage report
Build the application for production
"build:release": "npm run test:release && ng build --prod",
"prebuild:release": "npm ci --production --no-optional",
"test:release": "ng t --configuration=ci-release
Special thanks to Wincent Papousek who has been my partner in crime for getting our tests integrated with TeamCity. 🙏
Call to Action
I always enjoy feedback so please 👏, 📝 and tweet 🐦. Follow me on Twitter and Medium for blog updates.